Every so often I try to forecast a value in the future that lies on a logarithmic curve. Every time this happens I fire up Google Sheets, drop in my known x and y values, plot them on a graph, add the logarithmic trend line, show the formula as the label, and then hand write the formula to predict future values.
It works fine, but it feels like such a manual hack. Every time I go through this exercise I end up down the rabbit hole of Google Sheets / Excel blogs in an attempt to do the whole thing without the creation of the chart and the manual extract.
Every time I fail.
Until today. I present you with the magic formula for doing a logarithmic forecast in Google Sheets:
=forecast(ln(**NEW_X_VALUE**),**KNOWN_Y_RANGE**,arrayformula(ln(**KNOWN_X_RANGE)))
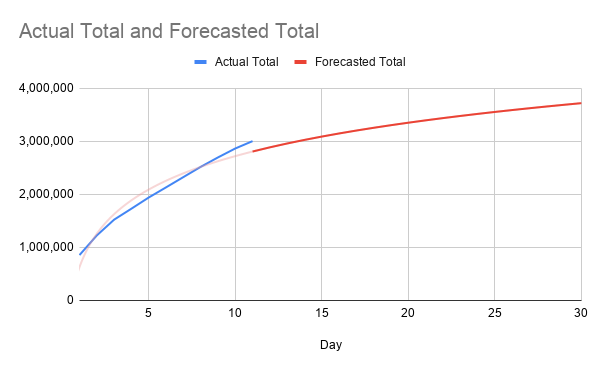
Here is an example.
The forecast function create a linear forecast, but if you take the natural log of the x values you make it logarithmic. That's the secret. I'm leaving this here for myself mostly, but hopefully you find it and it helps you as well.